Interactive presentations
Trade flat long-form PDF experiences for an interactive web presentation format, full of video content, animations, and reader participation.
Industries
Set your imagination free with content that inspires


Showcase
View examples of digital content that has been created using Vev.

Case Studies
Discover how industry leaders are using Vev for success.


Blog
Dive deeper into the world of creative no-code web content.
Whether you’re an international organization or a small startup, a well-designed annual report is a powerful tool for engaging your network and amplifying your message.
Whether you’re an international organization or a small startup, a well-designed annual report is a powerful tool for engaging your network and amplifying your message.
“Annual report” is a deceptively simple term that has come to house a plethora of different forms of branded content. Depending on the size and nature of your company, it signifies wildly different things—from financial reports to year-in-review storytelling.
In the traditional corporate sense, an annual report is a chronicle of a company’s key activities, operations, and financial health for shareholders, potential investors, analysts and other stakeholders. It’s a huge document that can run up to hundreds of pages.
Yet increasingly, annual reports are becoming elite marketing tools for strengthening brand awareness. They celebrate company achievement, build connection with customers and employees, and hammer home important brand messages. These steer readers through an entertaining and engaging narrative, and—in the case of Spotify’s Wrapped—can cleverly make the customer the hero of the story, instead of the brand.
Annual reports are an opportunity to provide an in-depth analysis of your company’s overall performance and health—which is vital information for investors, stakeholders, and even public consumers who are increasingly demanding transparency from influential corporations. There are various reasons why businesses and organizations produce them, and depending on the nature of your business, the format, design, and content you choose to include will vary dramatically.
These typically include an opening editorial from the chairman, or CEO, management analysis, audit reviews, testimonials, and financial performance statements for the previous fiscal year. In many jurisdictions, producing these types of annual reports is a legal requirement—particularly for public companies.
The modern answer to an annual report, annual wrap-ups use storytelling to amplify company values and foster a sense of community around a brand. These often highlight statistics on consumer feedback and product development, customer and employee spotlight stories, corporate responsibility segments—including pro bono work, philanthropy, initiatives, workshops—as well as company achievements.
Of course, your annual report can straddle both of these approaches—depending on the level of reporting you need to include and your overall brand strategy. Here are a few factors to keep in mind:

Financial audit: Numbers and data can quickly become dense and overwhelming. Annual reports make use of charts and infographics to break down numerical data and statistics so information such as income statements, balance sheets, and financial summaries are easily understood.

Communication: When done right, annual reports can be great pieces of business and corporate communication. Highlighting marketing strategies, executive changes in the pipelines, and future endeavors keep all stakeholders in the loop.

Marketing and promotion: Many companies use annual reports as another medium for promoting marketing initiatives. As a marketing tool, they are a link between audiences and the company itself, and a perfect opportunity to use visual storytelling to engage, share and promote company values and feel-good stories.

Company milestones: Reaching major milestones and achievements is something to be celebrated. Sharing those accomplishments with your audience highlights the positives of your company and increases brand awareness.
Annual reports are typically created using PDFs or other static content creation tools, and often run to hundreds of pages. Yet digital consumers are increasingly expecting more personalized and immersive digital content experiences—and in a digital world of extremely short attention spans, content needs to cut through quickly.
Modern web creation platforms have come a long way in helping companies access cutting-edge, interactive digital formats and techniques to ensure their most critical branded content is memorable. Aside from improving reader engagement, choosing a dynamic annual report design format can also bolster your brand’s perception as relevant, innovative, and contemporary. Here are just a few popular options consider:
Trade flat long-form PDF experiences for an interactive web presentation format, full of video content, animations, and reader participation.
Turn your linear annual report into a carefully constructed world that readers can plot their own path through.
Tell a long-form immersive visual story through one interactive web page.
A static PDF won’t cut it these days. Interactive presentations full of video content, animations, and reader participation are a novel alternative. This format allows you to combine storytelling with interactive content such as quizzes to engage your audience.
E-magazines
Another sophisticated alternative to the traditional flat PDF or printed brochure. This format allows you to use a design you are already comfortable with, while taking advantage of all the flourishes, animation, interactivity, and rich media that modern web design has to offer.
Microsites
Swap the traditional linear annual report experience for a multi-directional world that readers plot their own path through. Microsites are a perfect format for annual reports, as they force you to structure and deliver your information in a way that’s clear and digestible.
Landing pages
As with microsites, landing pages exist as a microcosm within a brand’s digital presence. Direct and immediate, they also keep your readers on your website, allowing you to steer them on to other related content or take a specific action. Best suited to shorter-form reports, you can still pack in quite a lot of information—leveraging animation and visual storytelling techniques to keep people scrolling through.
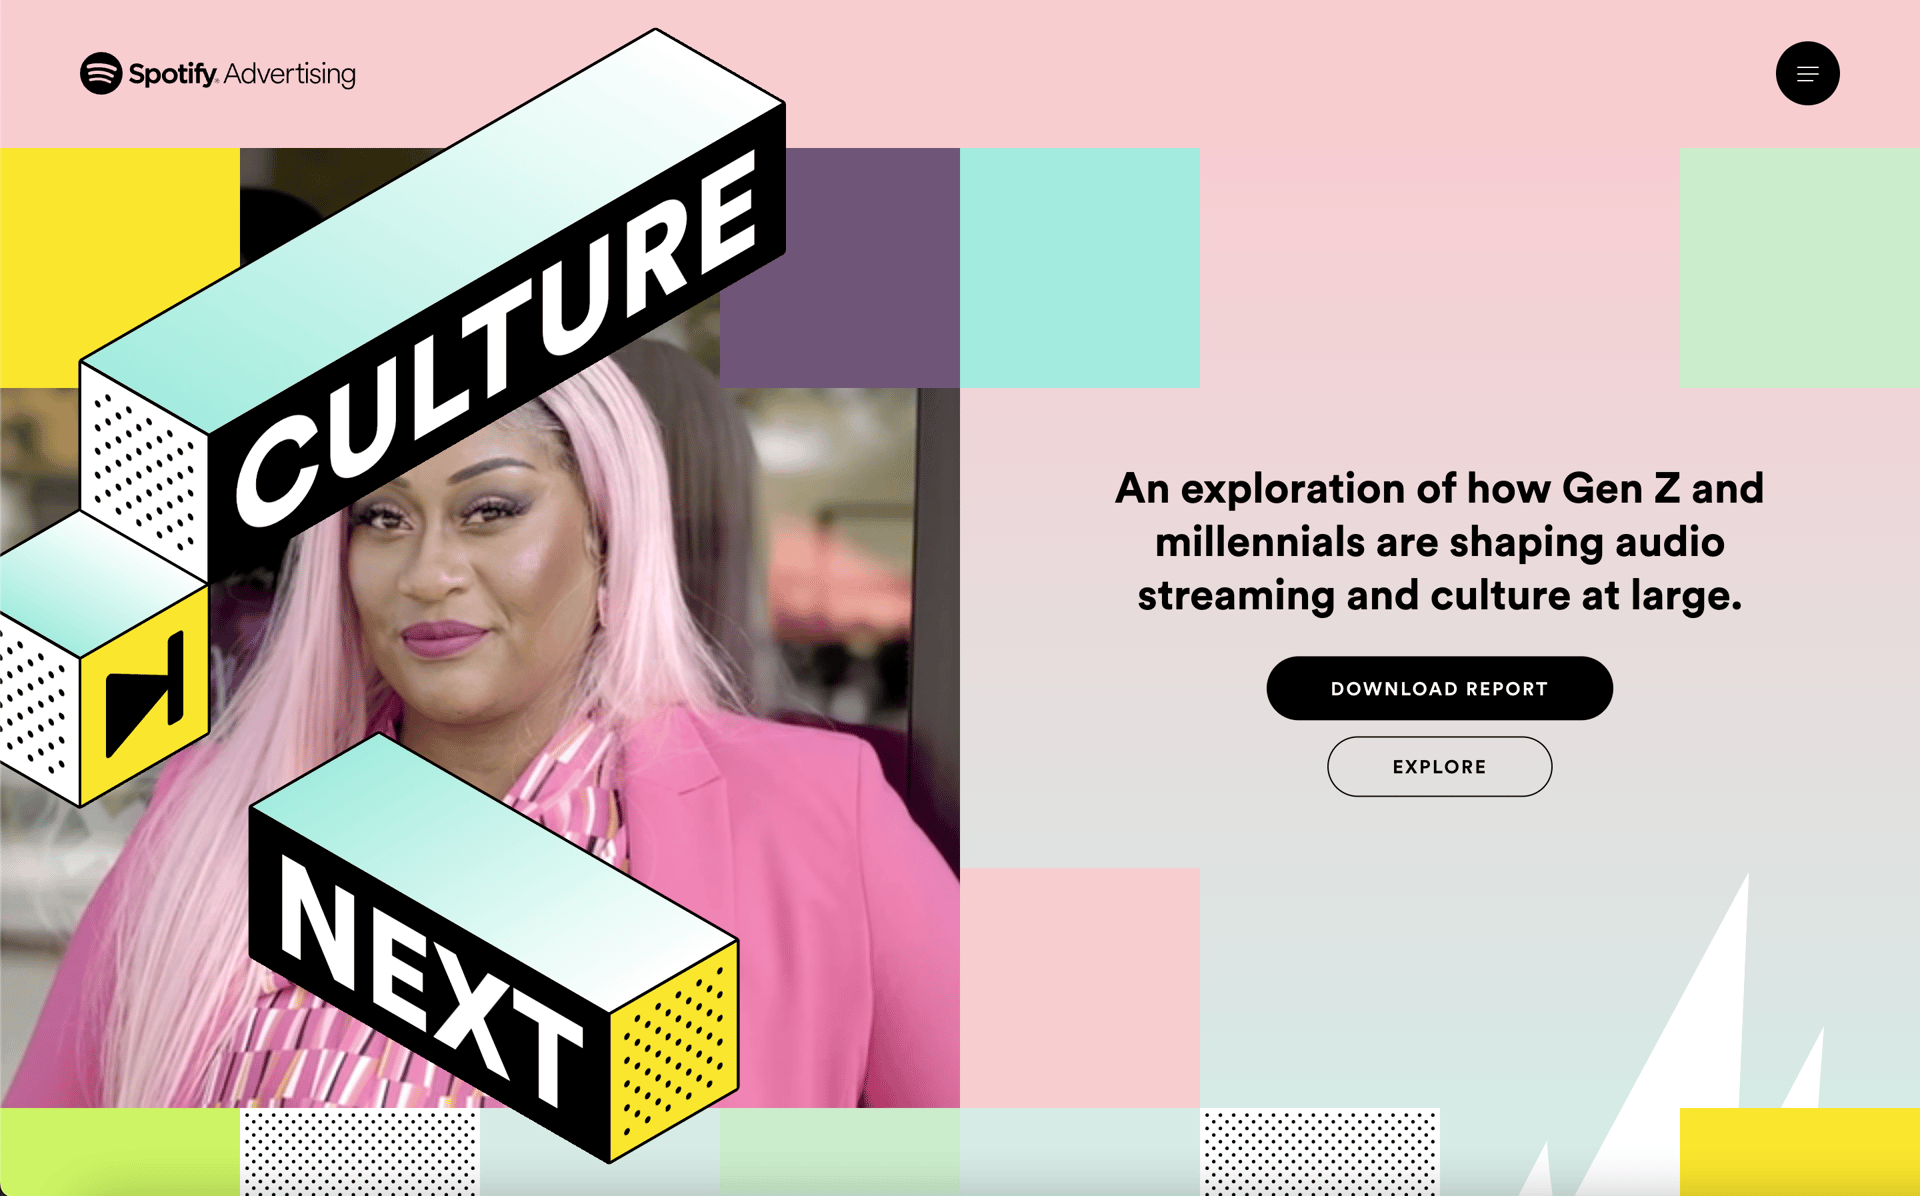
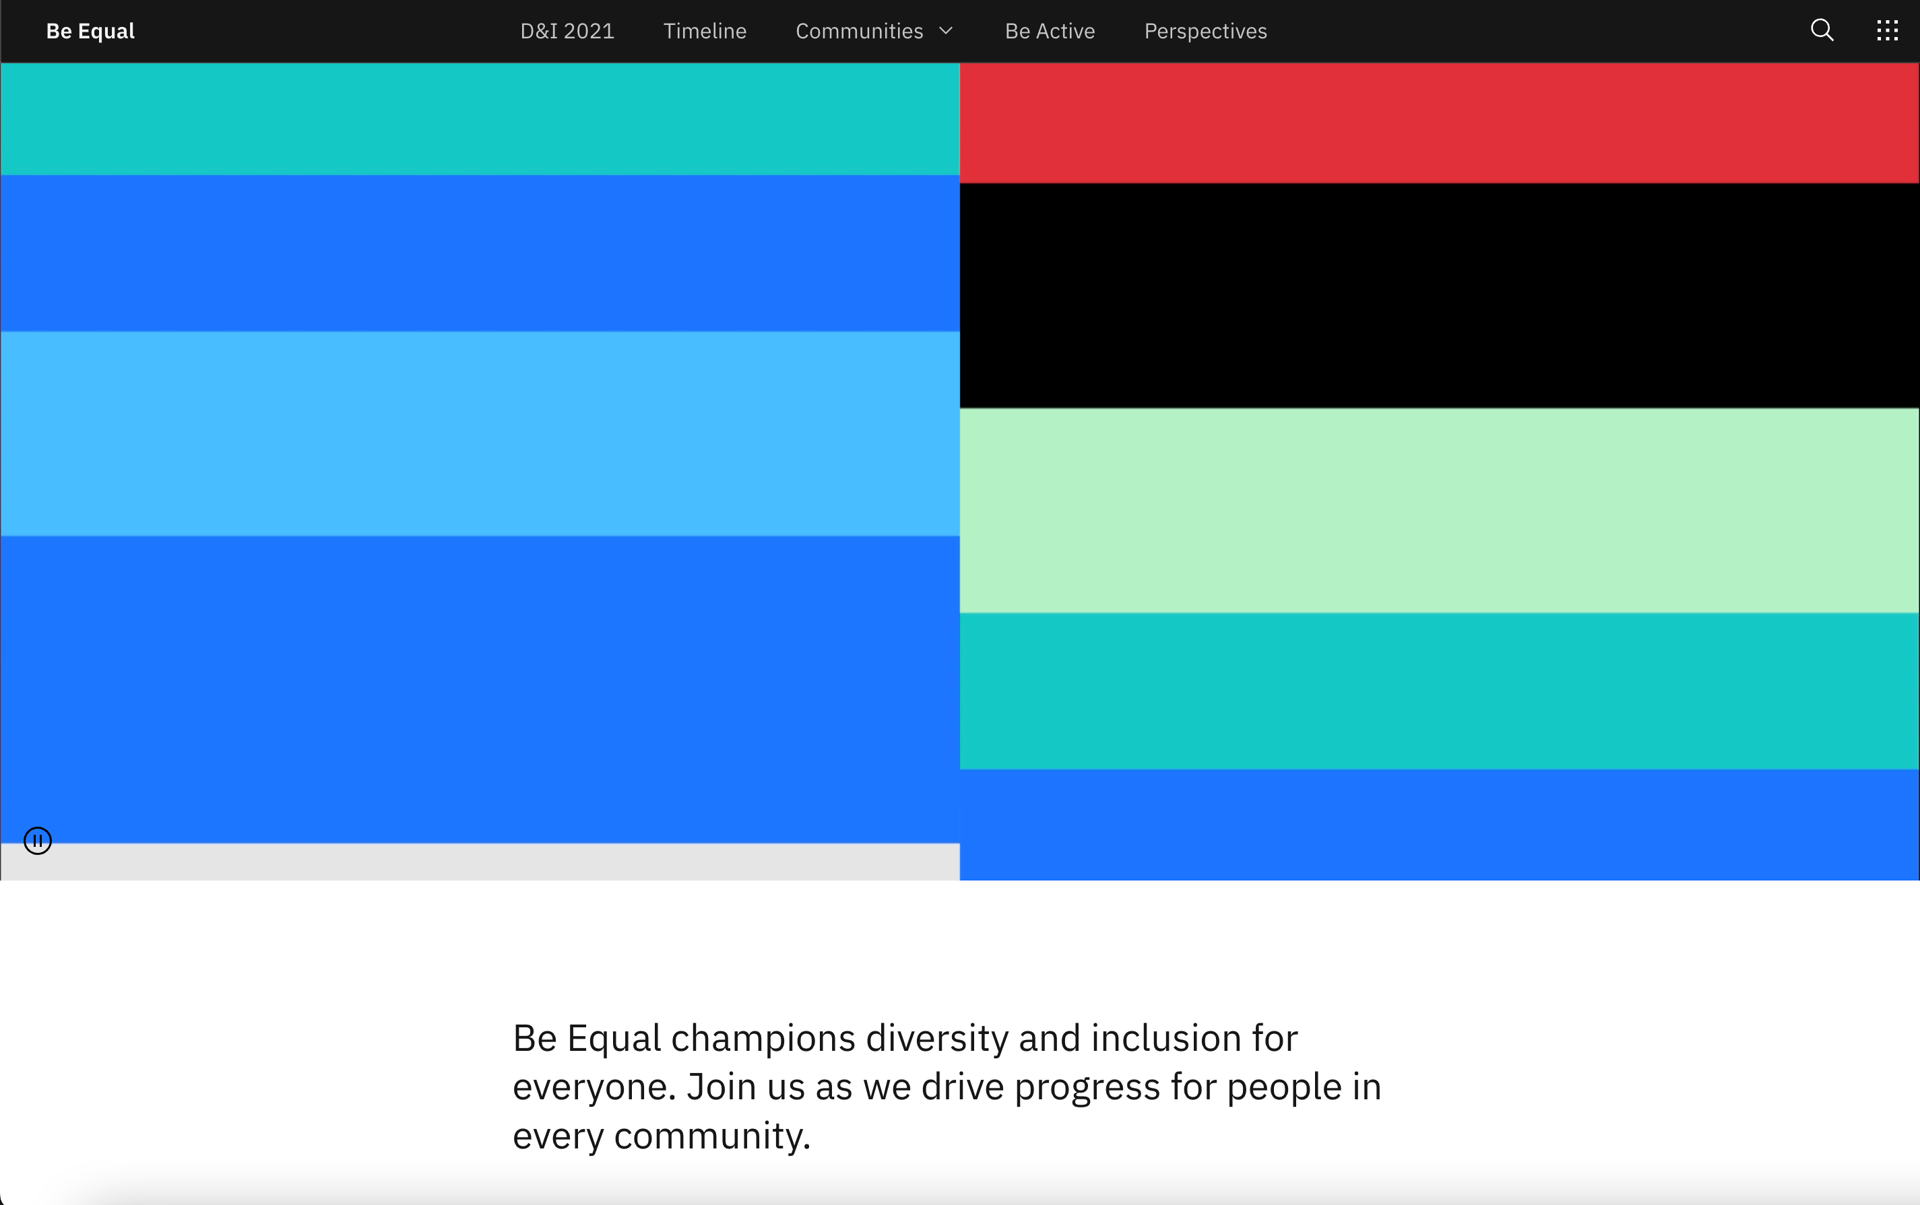
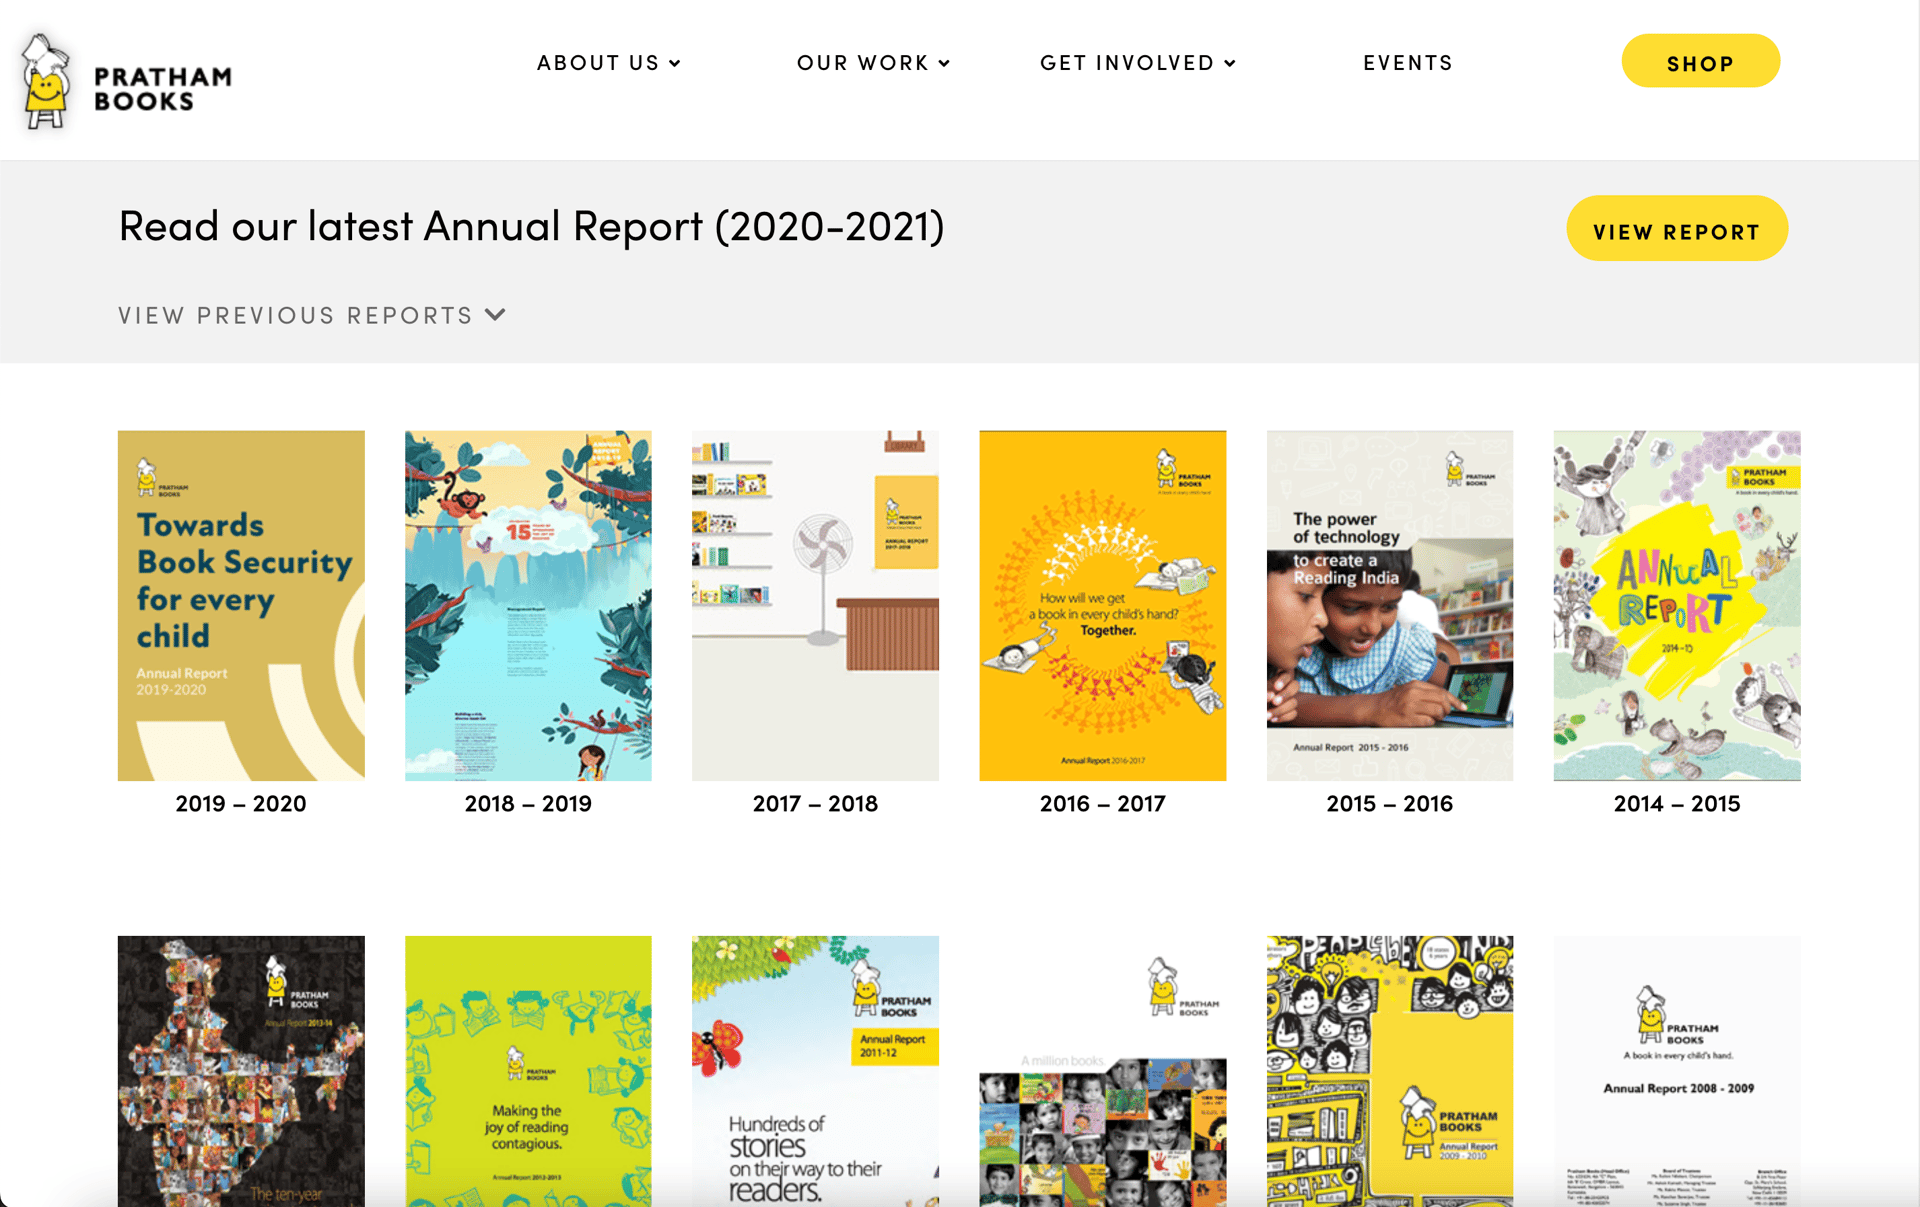
Wondering how these effects work in context? Take a look at these annual report examples to draw inspiration for your next project. Check out our own Year in Review reports too.
There are many benefits to building a web-based annual report filled with interactivity and animation over a static PDF one. It’s a huge opportunity to be creative and show your brand personality in an authentic way. From interactive maps and charts, to horizontal scrollytelling, here are a few of the most interesting annual report design techniques to experiment with.
Background elements move at different speeds to foreground content, creating instant depth and perspective. Take this to the next level by using a full-width background video.
Engage readers with elements that appear or disappear on click. Great for pop-ups and quizzes.
As such a personal piece of branded content, your annual report needs to feel genuine and rooted in your organization. Yet many companies choose to outsource annual report design to external agencies.
For NGOs, startups, and small businesses this can be an extremely expensive option—particularly if more interactive design is involved. For larger enterprises, it can be time consuming, requiring tremendous back-and-forth as creative control becomes distanced from in-house brand and marketing teams. More often than not, the result is always a lackluster static PDF.
Yet, it doesn’t have to be either. The rise of no-code web creation tools is removing the technical barriers, timelines, and costs traditionally involved in producing premium annual reports with an external agency. Armed with a library of pre-coded interactive design components, companies can quickly produce exciting interactive annual reports for a fraction of the cost, while still publishing them to their existing domain.
Get a whistle-stop tour of designing a slick, animated annual report in Vev without coding a thing. You can find the complete template used in this video inside Vev to take a closer look at how all the sections we’ve covered fit together.
There are average annual reports, and then there are great annual reports that make you forget you’re even looking at one in the first place. While creating a standout annual report may seem tricky, it’s not as hard as you might think. Follow these annual report design best practices to create a communication people actually want to read.

Even the more corporate annual reports are increasingly moving away from starchy reporting and dry messaging. Nowadays, people want relatable content and engaging experiences. Topics like company milestones or achievements, fun facts, feel-good stories, even financial data can be visually engaging when presented in an accessible way, rooted in human intrigue.

Storytelling appeals to our senses and emotions. Plus, it’s a powerful marketing strategy. As with any story, the key is showing audiences, rather than simply regurgitating information. Turn financial data and dry statistics into visual blocks or dynamic infographics that draw in readers and leave a lasting impression.

Want to keep audiences engaged? Forget static PDF formats and make your next annual report an interactive experience. Let your readers navigate the story at their own pace through the use of micro-interactions that encourage scrolling, or animations that drive interest and encourage exploration. Any form of simple movement can easily enhance the experience, particularly if your annual report has an eye-watering page count.

When creating your report, consider how it will actually be consumed. You’ll want to prioritize designing for the device your audience is most likely to use, while ensuring it is completely responsive for all screen sizes. Think about social distribution channels and content formats too, so parts of your report can easily be cut, sliced, and repurposed in images, video reels, multiple-card stories, pull quotes, and more.
Illustration and graphic-led
Introducing a character
Visuals that humanize brands
Animated data visualizations
Introducing a character
Visuals that humanize brands


Illustration and graphic-led
Animated data visualizations
Introducing a character
Visuals that humanize brands
Focus on human stories
Even the more corporate annual reports are increasingly moving away from starchy reporting and dry messaging. Nowadays, people want relatable content and engaging experiences. Company milestones and achievements, insights and facts, success stories, and even financial/investor data can be visually engaging when presented in an accessible and immersive way.
Add interactivity
User participation is a great choice, particularly if your annual report has an eye-watering page count. Instead of serving up static PDFs, offer interactive digital experiences that breathe and flex as readers move through them. Weave in micro-interactions that encourage scrolling, or animations that drive interest and encourage exploration. You can even consider creating tangent stories that readers can choose to pursue at their own pace, but any form of simple movement can easily enhance the audience experience.
Design with distribution in mind
One thing you need to consider when creating your report is the various content distribution formats. Consider how and where your annual report will be consumed—prioritizing the device your audience is most likely to use, while ensuring your design is completely responsive for all screen sizes. Think about social distribution channels and content formats too, so parts of your report can easily be cut, sliced, and repurposed in images, video reels, multiple-card stories, pull quotes, and more.
Prioritize visual storytelling
Storytelling appeals to our emotions, making it a powerful marketing strategy; visual storytelling ensures readers actually consume your annual report through to its conclusion. Transform flat quantitative data into dynamic infographics and charts, and balance text with photographs, graphics, and video—developing visual design in tandem with copy production, rather than treating it as an afterthought.
Looking at the big picture is all well and good, but don’t fail when it comes to the detail. If you’re creating a long-form annual report, a well-designed cover is essential. This is the visual that will be plastered across all your marketing distribution materials—social media, website banners, newsletters, landing pages, and beyond. It’s the first impression of your annual report and your brand, so it needs to pop.
Your annual report cover will act as an introduction to a whole year's worth of activity, so it will take some planning. As a starting point, ask yourself these three questions:

Who is your audience?
Even within brand guidelines, you’ll want to tailor your cover design to match the tone and content of your report. A corporate financial report will likely need a very different look and feel to a report celebrating young creatives in your community.

What are you communicating?
Key messaging and phrases need to be front and centre. Good content design is a shared effort between designers and copywriters, and neither should work in isolation of the other.

Where will this be viewed?
If you are designing for web only, then consider the different devices and platforms your cover art should be optimized for. You’ll need to design for mobile, tablet and desktop, as well as altering your dimensions depending on which social media platforms you may share your annual report on. Just make sure you get this all sorted before you hit publish!
The style of your cover design should set the creative direction for the rest of your report and any surrounding content, such as landing pages. If your cover is graphics-led, your report shouldn’t then be dominated by photography or typography. Whatever you decide, make sure your artistic choices are consistent. People should see the cover and the full annual report as one piece of content.
Feel free to explore and create as many projects as you'd like for free! Then select the plan that's right for you when you're ready to publish.
Let's make the web a more beautiful place, together.
Whether you want to make an interactive e-magazine or scrollytelling landing page, Vev’s library of pre-coded design components lets you bring your annual report to life just as you imagined it. Publish your annual report anywhere on the web when you’re ready.