
10 Stunning Interactive Data Visualization Examples
November 4, 2022
Words by Jeff Cardello
Interactive data visualizations make your information more interesting, comprehensible, and engaging.
Data visualization offers an artistic and logical way to deliver numbers and other information to website visitors. These graphic representations improve understanding, offering a clear way of taking in data and understanding its relevance.
In today’s world, interactivity elevates this content to a level that promises to engage your audience, allowing them to analyze the data within the visualization itself. Whilst adding interactivity may seem daunting, the most innovative web creation platforms now offer a plethora of plug-ins and pre-built design elements that make it easier than ever. Take inspiration from our favorite interactive data visualization examples below.
What is Data Visualization?
Raw numbers alone aren’t enough to tell a good story. Data visualization transforms dry quantitative data into something far more tangible and easy to understand. Visuals like charts, diagrams, infographics, and other graphic representations provide context and deeper meaning, and can elevate the look and feel of a website.
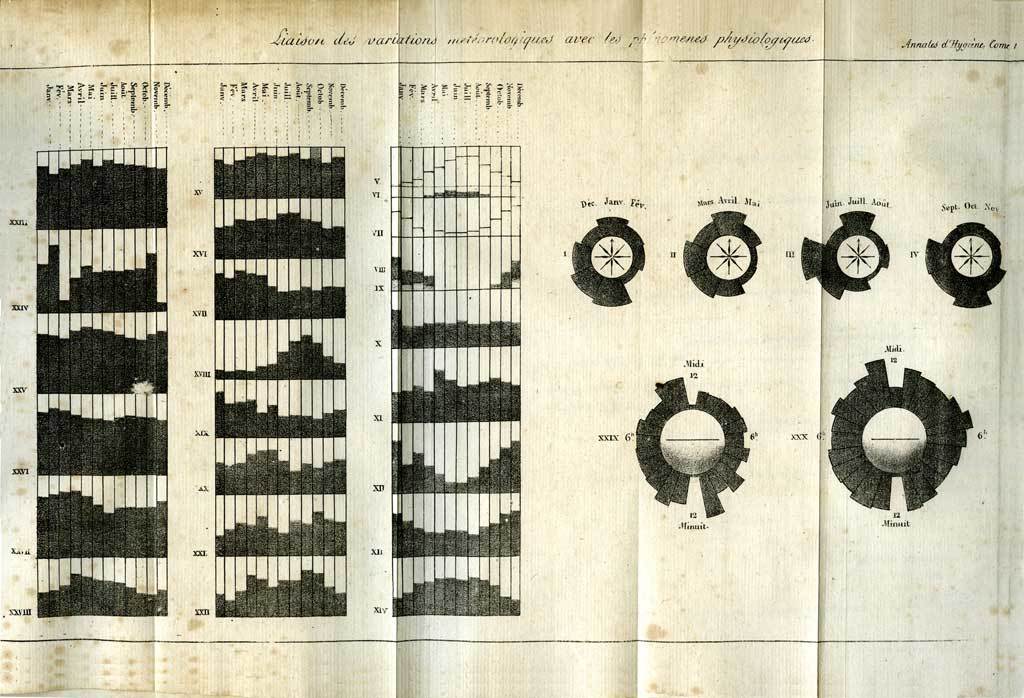
Though we associate data visualization with modern web design, its roots can be traced back to the 17th century. Maps were filled with illustrations showing cities, landmarks, resources, and other guides making them simple to decipher and navigate, such as this chart of the Polar region by André Michel Guerry dated to 1829.
Techniques for visualizing data advanced through the 1800s giving rise to many of the methods that are still in use today. Histograms, scatterplots, line graphs, and other graphic tabulations were all developed to better communicate the significance of data.
Today’s designers have a multitude of techniques and tools to sculpt numbers to tell a gripping visual story or captivating piece of data journalism. Within the web design space, interactivity has allowed storytellers to bring their data to life. Interactive data visualization examples are now a dime a dozen; from clickable maps to scroll-animated pie charts, data visualizations can visually unfold through a variety of microinteractions.
How Does Interactivity Elevate Data Visualization?
Plain graphs and charts, though effective in displaying data, only provide a singular way of experiencing information. Your audience may take a glance, before quickly scrolling on. As we will discover from the interactive data visualization examples below, the element of interactivity draws people, visually asking them to spend more time thinking about what’s being communicated.
In addition to its role in providing more active and visually engaging user experiences, interactive data visualizations encourage you to explore the data yourself. Through micro-interactions and visitor-initiated actions, additional layers of details can be revealed, providing even more depth and meaning to the data. In this way, interactive data visualizations encourage you to invest in the information at stake, and yield greater understanding of what it means.
Interactive Data Visualization Techniques
Interactive data visualization examples come in many forms. Let’s take a look at some of the most common techniques used in modern web design.
Animated Charts
Pie charts, line graphs, infographics, and other types of interactive data visualization examples may have animated features that function in capturing people’s attention and focus.
Number Counters
There’s something satisfying about seeing number counters tick upwards. The flash of number counters conveys the magnitude of data as well as building a sense of excitement.

Buttons
Interactive data visualizations may have buttons or other UI elements that move visitors through different panels of information or reveal additional data.
Show and Hide
Show and hide effects are often triggered through hovering, momentarily making numbers, text, or visuals appear on the screen and then disappear when the cursor moves elsewhere.
3D Elements
Augmented-reality-inspired graphics, topographic maps, and other three-dimensional objects make moving through data a more immersive and interactive user experience.

Scroll-Triggered Animations
Graphs, numbers, charts, text, and other interactive data visualization examples may all have effects applied to them that makes data stand out from the rest of the content.
10 Interactive Data Visualization Examples
Data doesn’t have to be dry and static—there are so many interesting and captivating ways to experience it. The following interactive data visualization examples break down a variety of techniques you can use to bring your own data to life.
Pine Cove Camp
Built with Vev, Pine Cove Camp shows what makes their summer camp special through sunny photos, testimonials from attendees, and a bright and colorful layout.
Throughout this interactive data visualization example, they include statistics reflecting who their campers are, as well as their experiences. This infographic shows three distinct groups of campers, with an interactive drop-down that gives more insights into how their scholarships have helped them out.
Tualatin River Watershed Navigator
Watersheds are complex ecosystems. This interactive data visualization example shows how soil, wildlife, plants, and precipitation are interlinked in the Tualatin River Watershed located in Oregon. All of this data is navigated by moving through its three-dimensional expanse.
This digital journey brings you through the hills and valleys of this watershed. Each level of navigation brings you one step closer to the landscape until you’re brought to the ground level, which is filled with brilliant landscape photography and information.
This visually-driven design makes you feel like you are right there. Along with a user experience that captures this area’s natural beauty it also communicates the science behind its delicate ecological balance.
Human Rights House Foundation
The Human Rights House is an organization dedicated to helping people across the globe. This 2021 report designed with Vev covers a lot of information, with a focus on the conflict between Russia and the Ukraine and its worldwide implications. In discussing these global human rights issues, there’s a great deal of text, which is where visual effects like parallax scrolling and animated data visualizations help to lighten the overall experience.
The following block of statistics shows their international presence as well as accomplishments. Animated number counters spring these data points into motion, making them jump from the screen, demanding your attention.
The Pudding: Wine Data Modeling
If you’re looking for a creative interactive data visualization example, The Pudding is always worth checking out.
For those uninitiated, data science can be used to build predictive models based on data sets like the Boston housing market, who survived the Titanic, and the characteristics of Iris flowers. Data science can be a bit intimidating, and this piece from The Pudding demystifies it by taking this well-known data set and showing how it can be used to make predictions about its quality.
You’ll find animated charts, scroll-triggered visuals, and interactivity in this brilliant piece that breaks down the basics of the data science behind this.
Service Now
Service Now stands out with this visually stunning and informative sustainability created in Vev.
This interactive data visualization example focuses on the importance of companies in meeting sustainability objectives. From the very start, visitors are delighted by scroll-triggered effects like parallax, fade-ins, and animated data visualization examples.
Along with a layout packed with action, there are also several animated charts. This animated graph takes form as visitors scroll down. Seeing these pieces fall into place makes this a more engaging graphic and highlights the data it aims to communicate.
World’s Biggest Data Breaches and Hacks
If you’ve ever looked for interactive data visualization examples, you’ve likely encountered the work of David McCandless, and his website Information is Beautiful. This blog is packed with imaginative data visualizations covering a wide range of environmental, health, tech, and other topics.
World’s Biggest Data Breaches and Hacks shows a variety of platforms and the data breaches they’ve suffered. A hover and hide effect expands each bubble, giving further details into these major hacks.
Vev Year In Review 2022
Annual reports are the chance to celebrate all that you accomplished during the year. We worked hard, and so did our users. In our 2022 annual report, we wanted to include a lot of data without it becoming too dense. We used a variety of visual effects to make it a more lively user experience.
An example of this is the animated numbers which make up the platform's key user base stats. We also included a 3D globe showing off our amazing team. These elements all combine to create an interactive, engrossing piece of content.
World Wildlife Fund
The Canadian chapter of the World Wildlife Fund shows the importance of biodiversity in this expansive Vev-built design filled with gorgeous wildlife and landscape photography, horizontally scrolled content, motion, and visual effects.
The following wide-angle shot of a pristine forest with a block of number counters moving upwards communicates some of the most important data related to their efforts in helping restore the environment.
QuintoAndar Housing Census
The QuintoAndar Housing Census reports on the demographics of Brazil and their connections to housing. A census, by its very nature, is a comprehensive collection of data and this design is filled with relevant statistics, figures, and other interactive data visualization examples.
Throughout this website are scroll-triggered animations that touch the various data points that keep up the energy and momentum, making it easy to take in everything that’s being conveyed.
The Tobacco Atlas
Though much has been done to build awareness about the health effects of smoking, tobacco use is still prevalent. Tobacco Atlas collects statistics about smoking, showing its effects across the world.
Tobacco Atlas gathers its key points in a horizontally scrolled section guided by a pair of arrow buttons. Each slide contains data along with writing that communicates its context. This is an effective interactive data visualization example which makes sure that no one skims past these important points.
Make Your Next Data Visualization Interactive
Vev makes it easy to awaken your data with interactivity. Just add your data and customize our pre-coded design elements—including animated charts, number counters, Flourish embed and Lottie animations—to present your data with more impact. Make and publish advanced interactive reports and data stories without writing a line of code.